
Production Monitoring Features
Job Scheduler
Job Summary
Job Shift Summary
Production Summary
Job Setup Sheets
Customizable Charts and Reporting
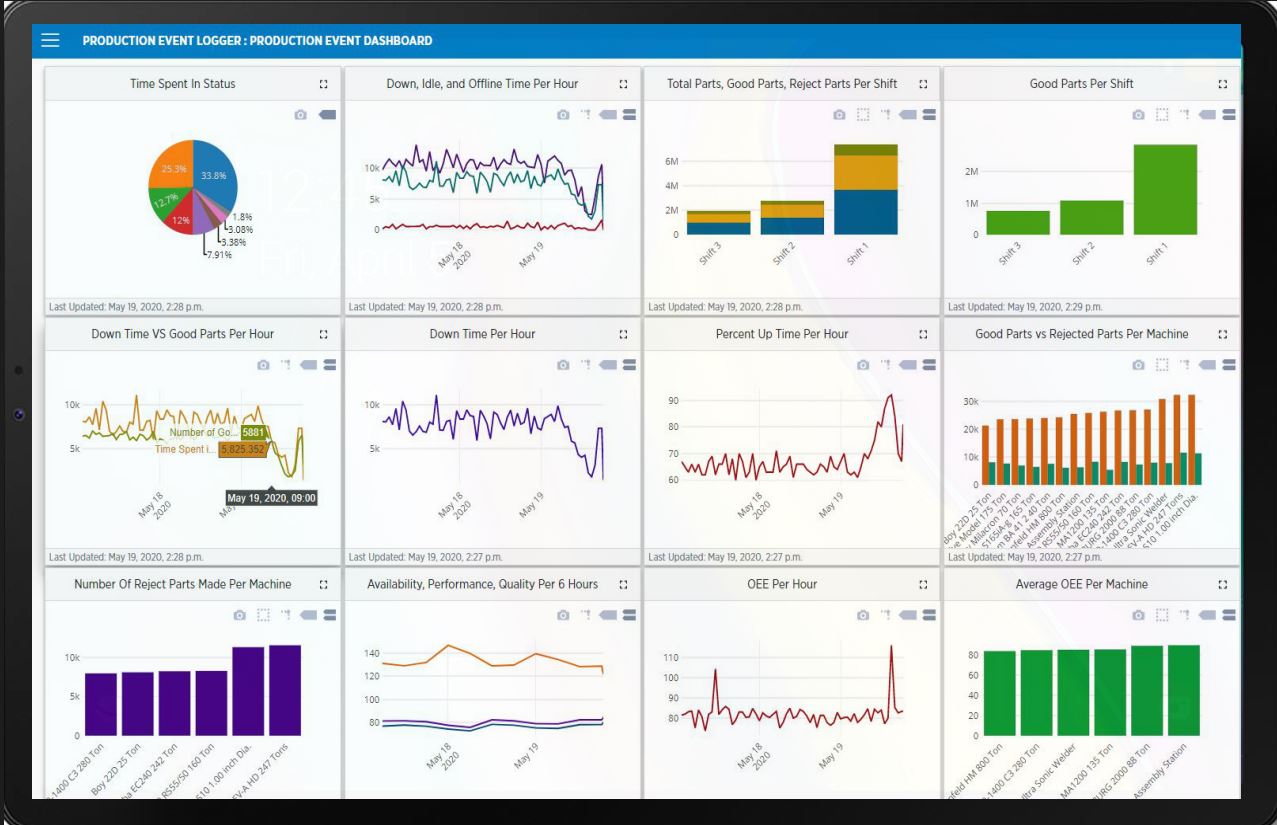
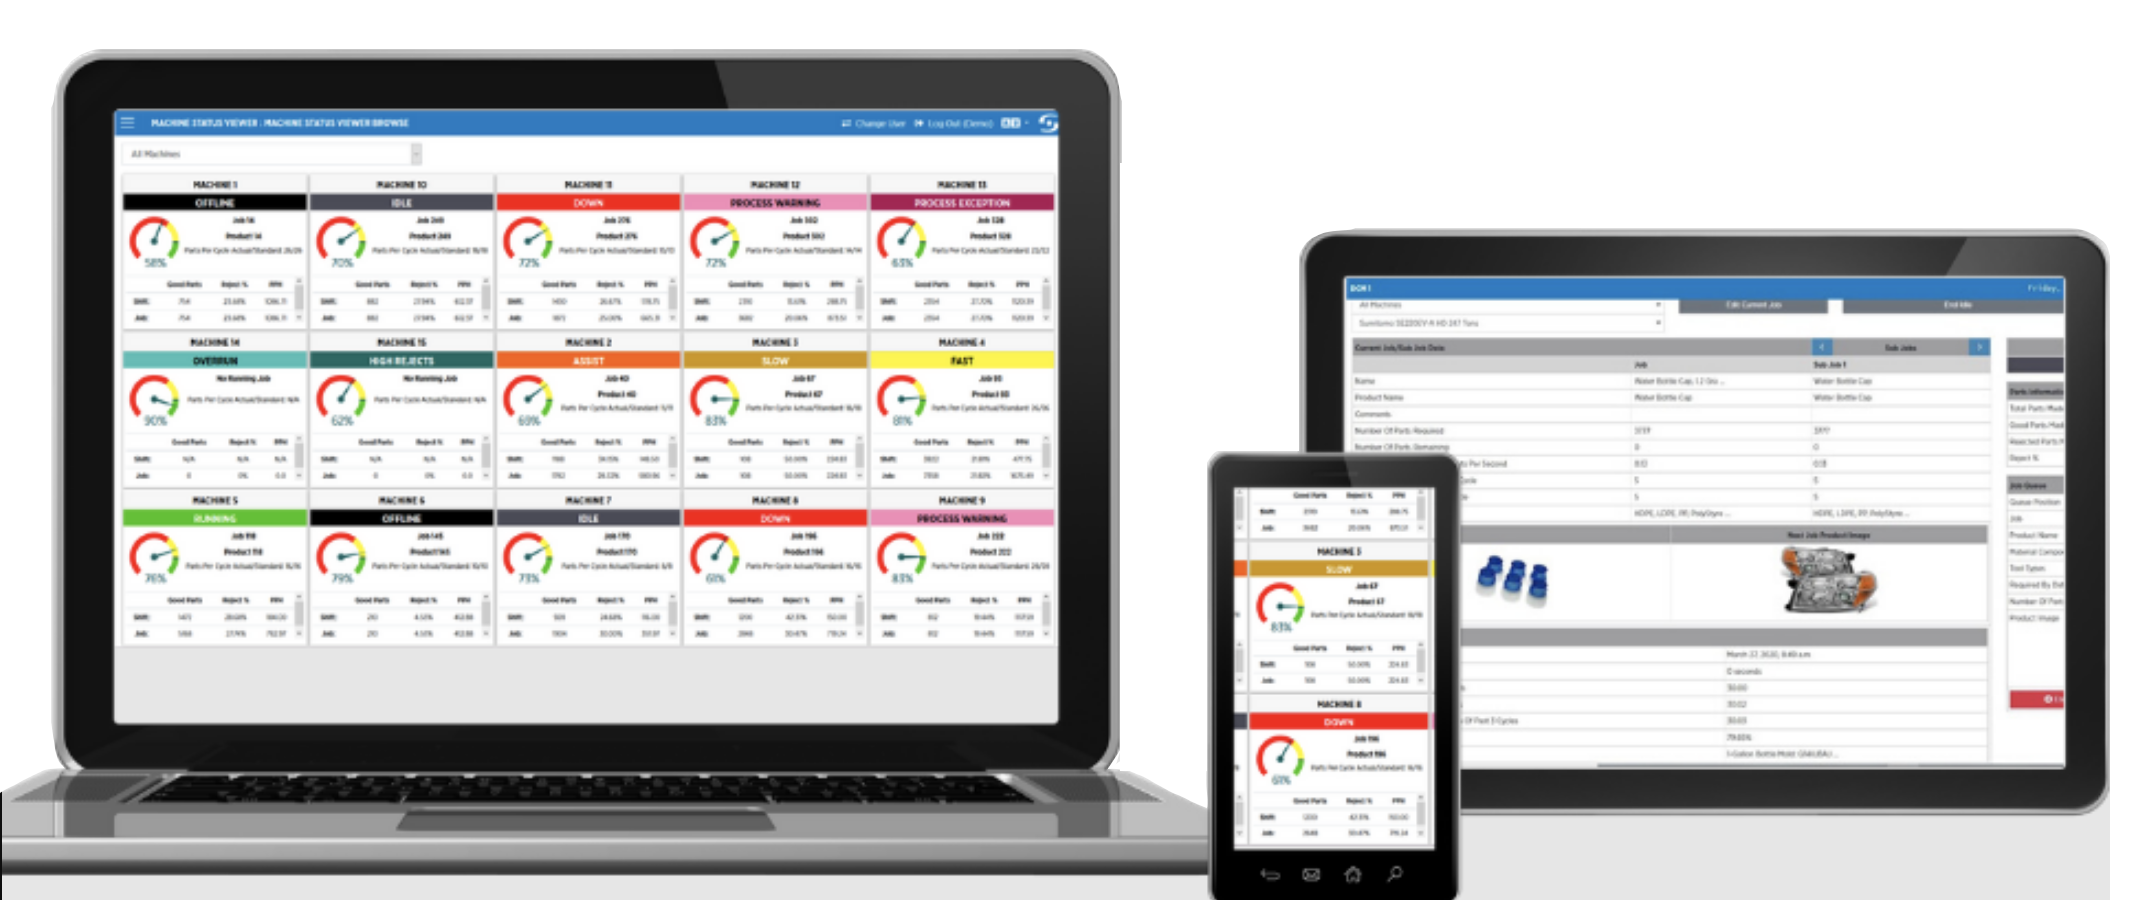
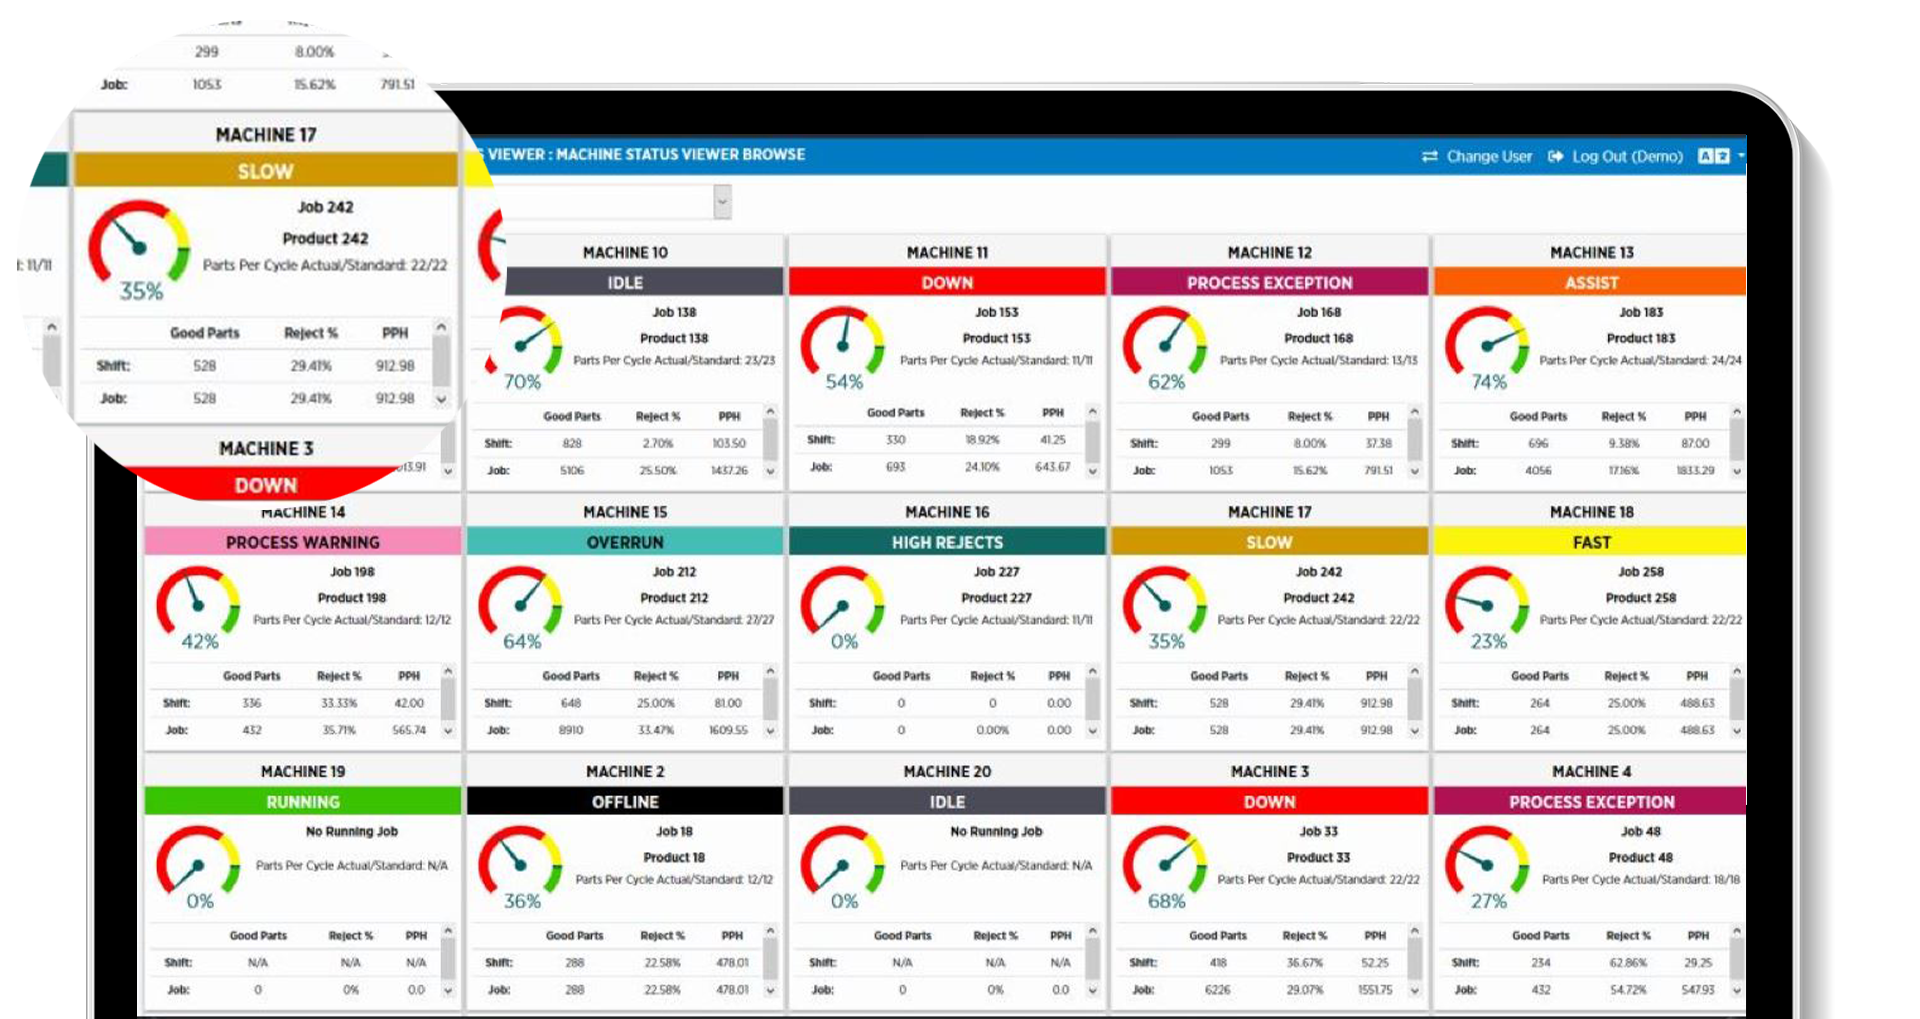
Real-Time Dashboards
Downtime and Scrap Reporting
Instant Alerts
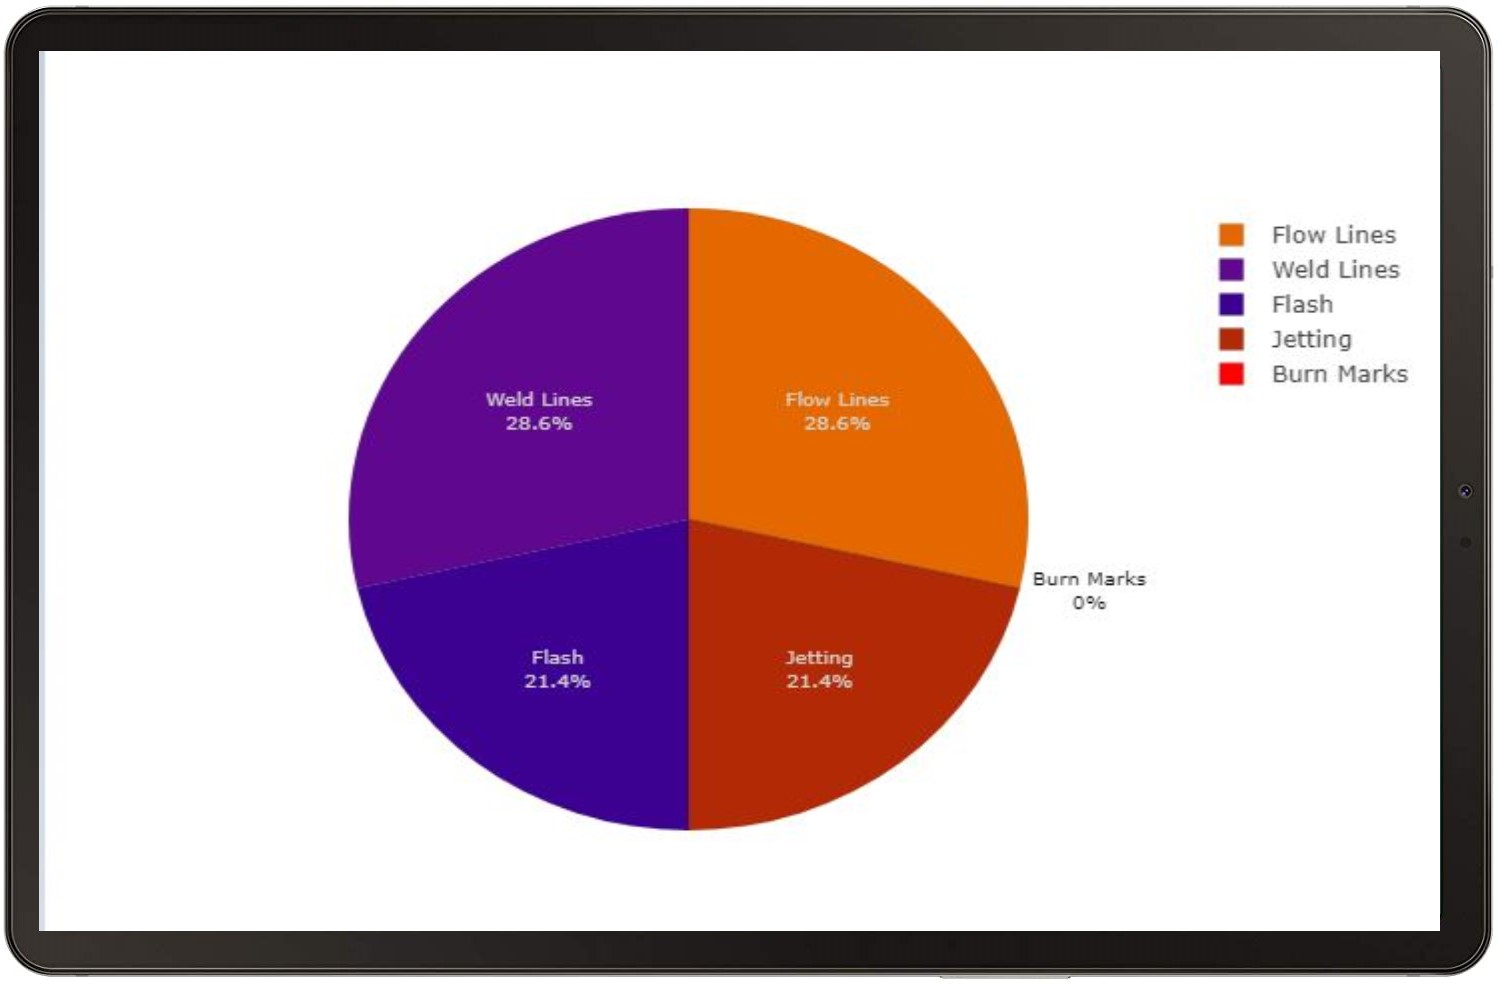
Defect Collection
Labor Tracking
Material and Tool Tracking
Job Scheduler
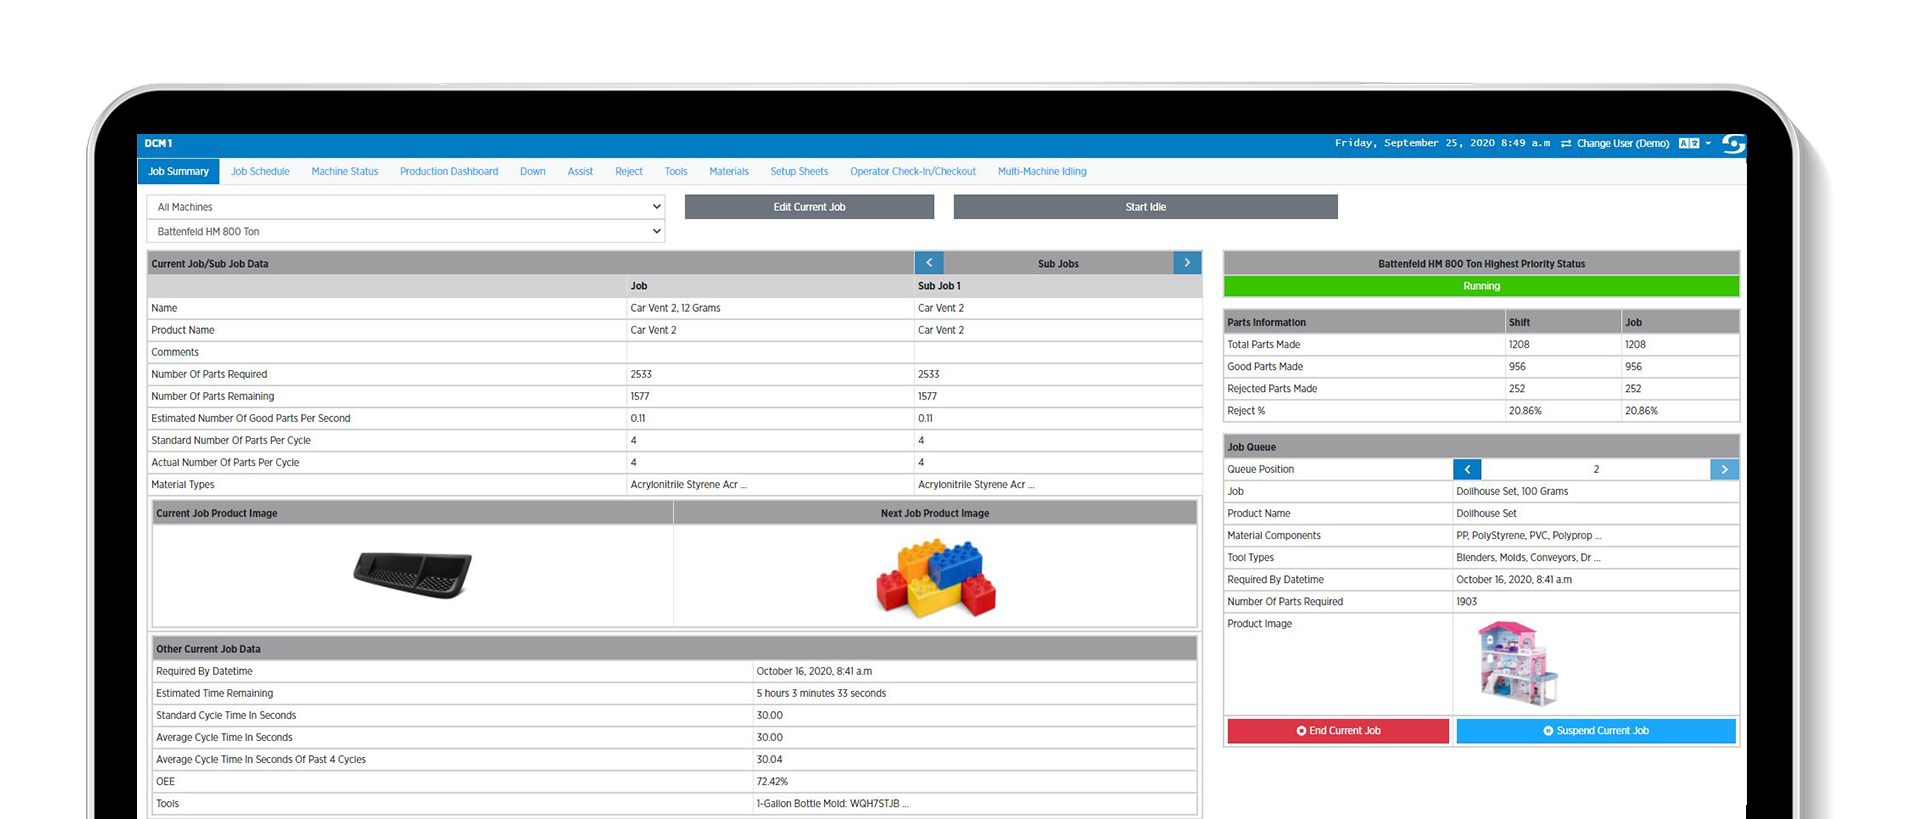
Job Summary
Job Shift Summary
Production Summary
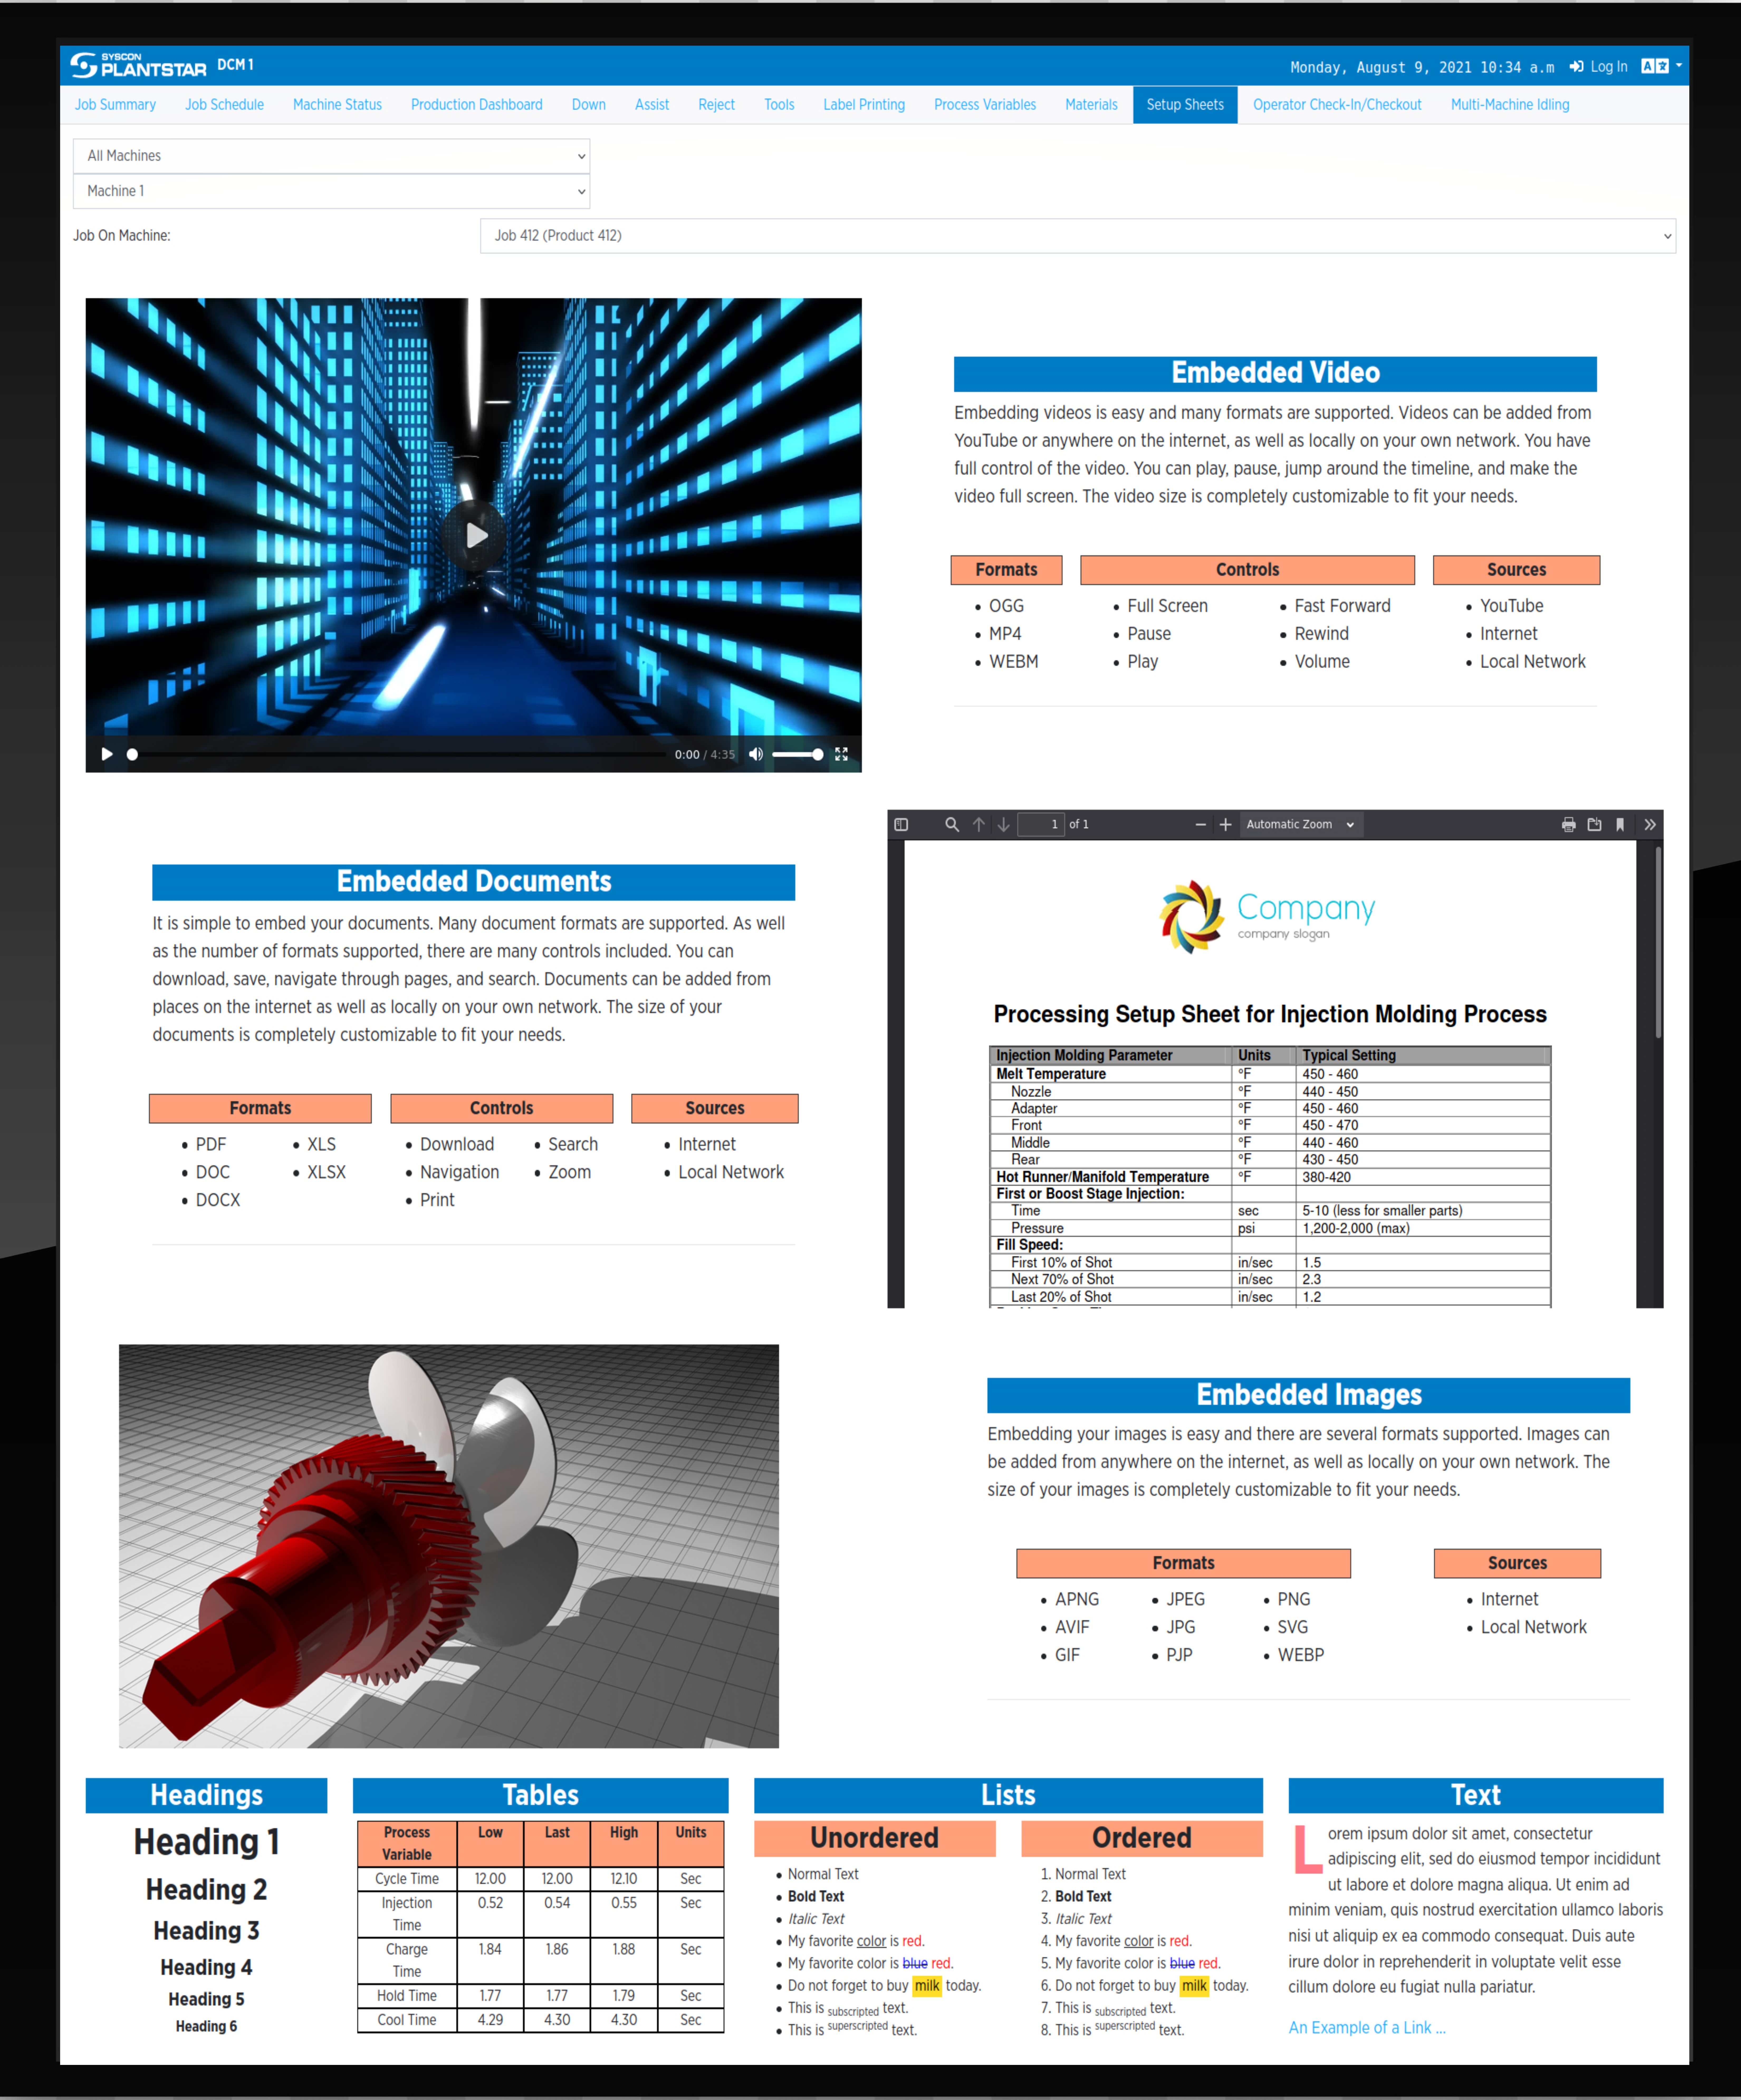
Job Setup Sheets
Customizable Charts and Reporting
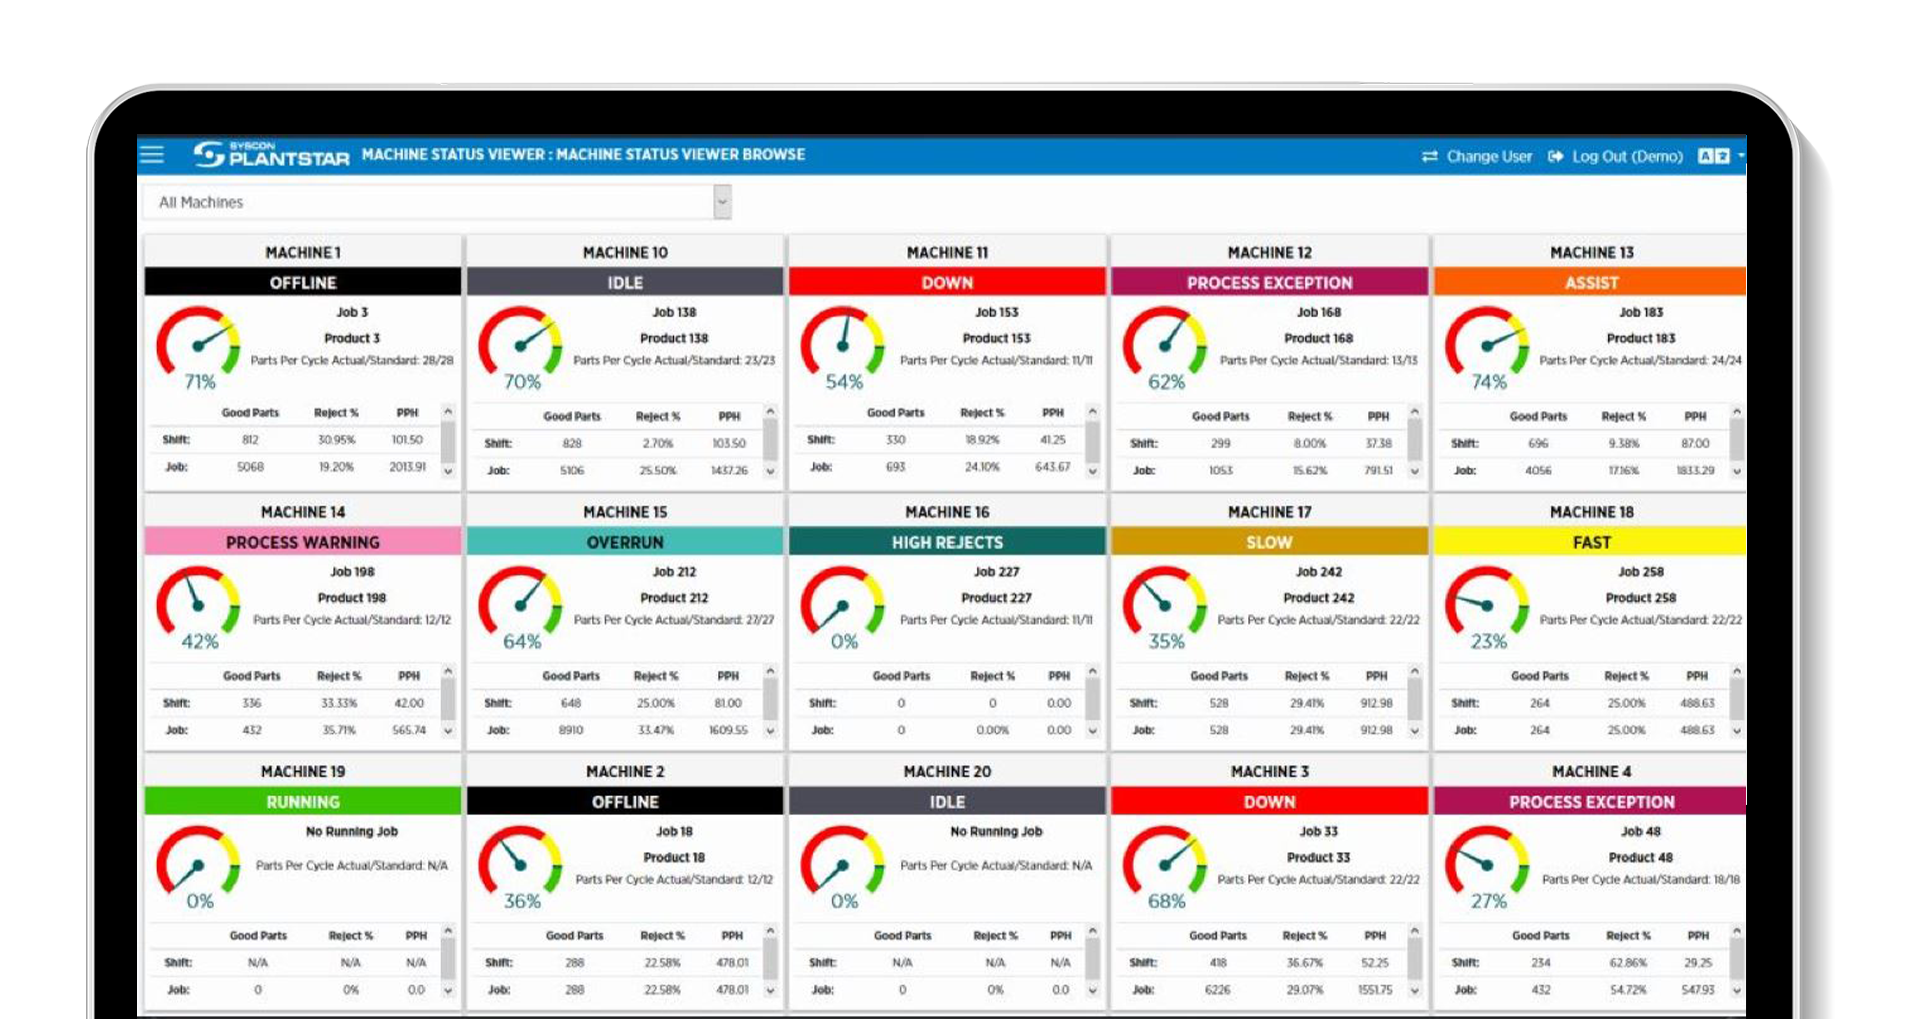
Real-Time Dashboards
Downtime and Scrap Reporting

Instant Alerts
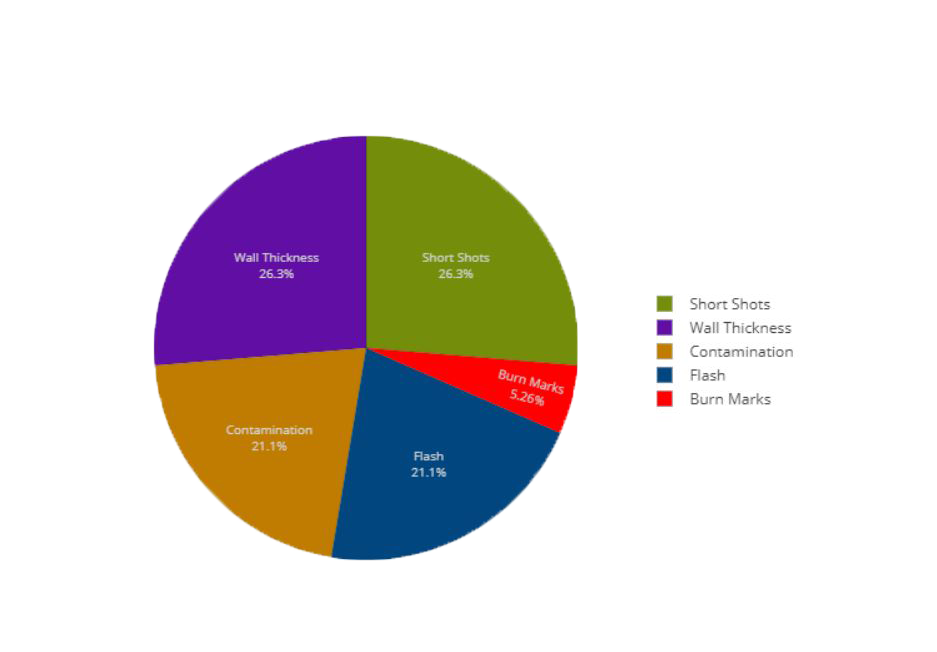
Defect Collection
Labor Tracking
Material and Tool Tracking
Production Monitoring Benefits
Operator Tracking
Labeling and Barcoding
ERP Integration
Voice Output
Remote Monitoring
Real-Time Data
Process Journals
Process Variables
Tools
Tool Maintenance Events
Operator Tracking

Labeling and Barcoding

ERP Integration

Voice Output
Remote Monitoring
Real-Time Data

Process Journals
Process Variables
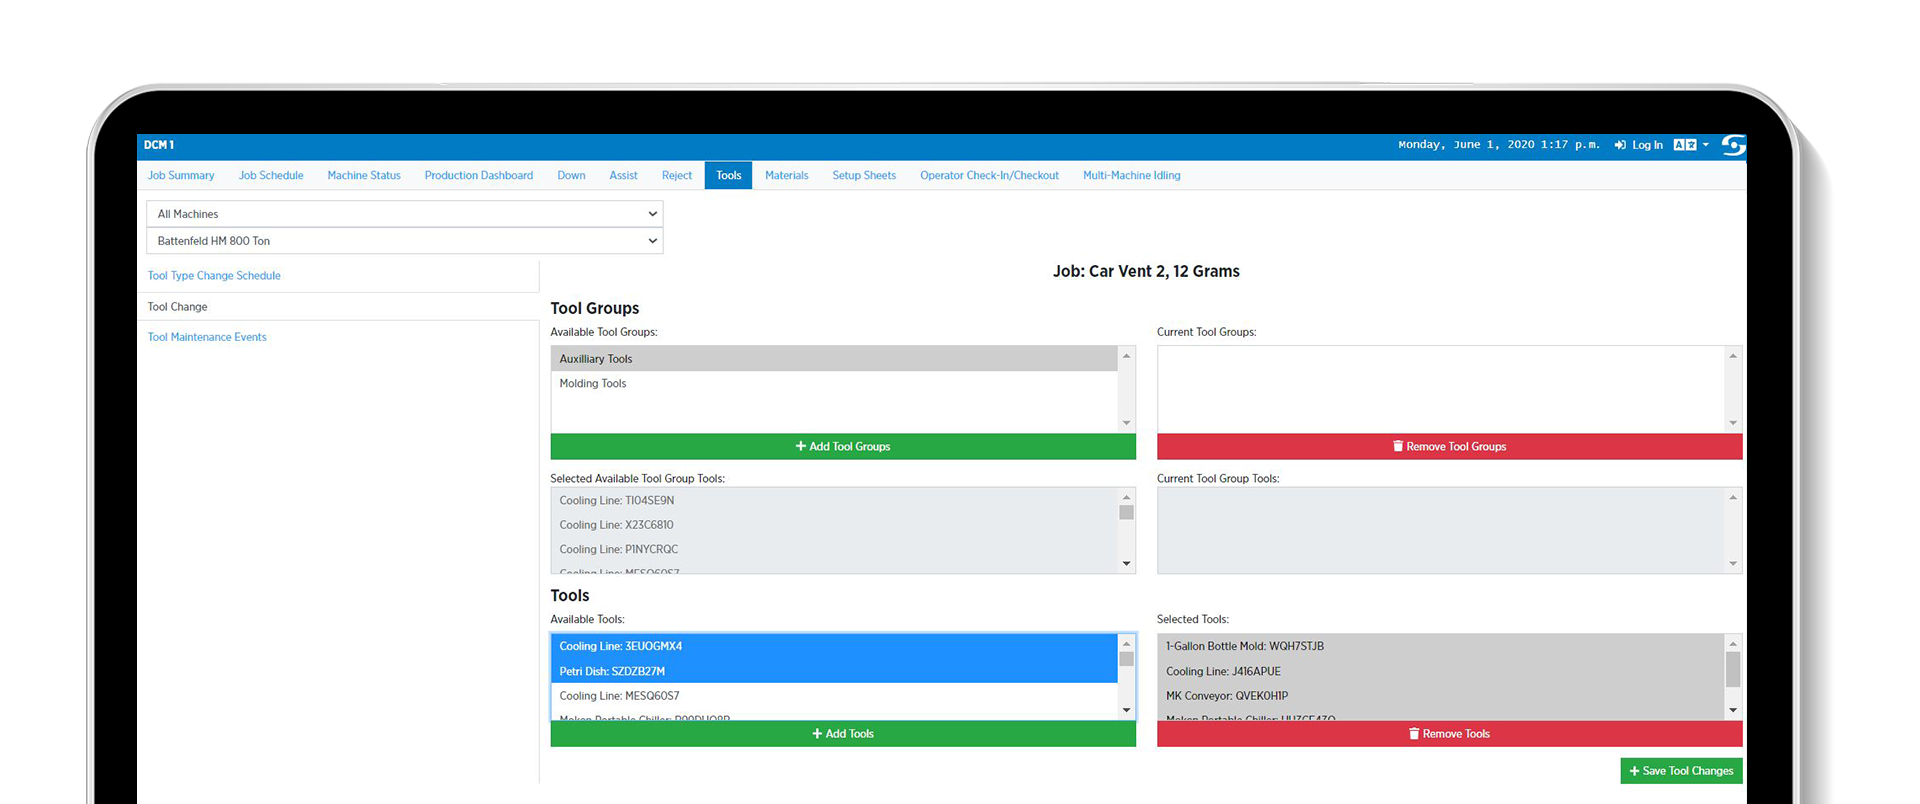
Tools
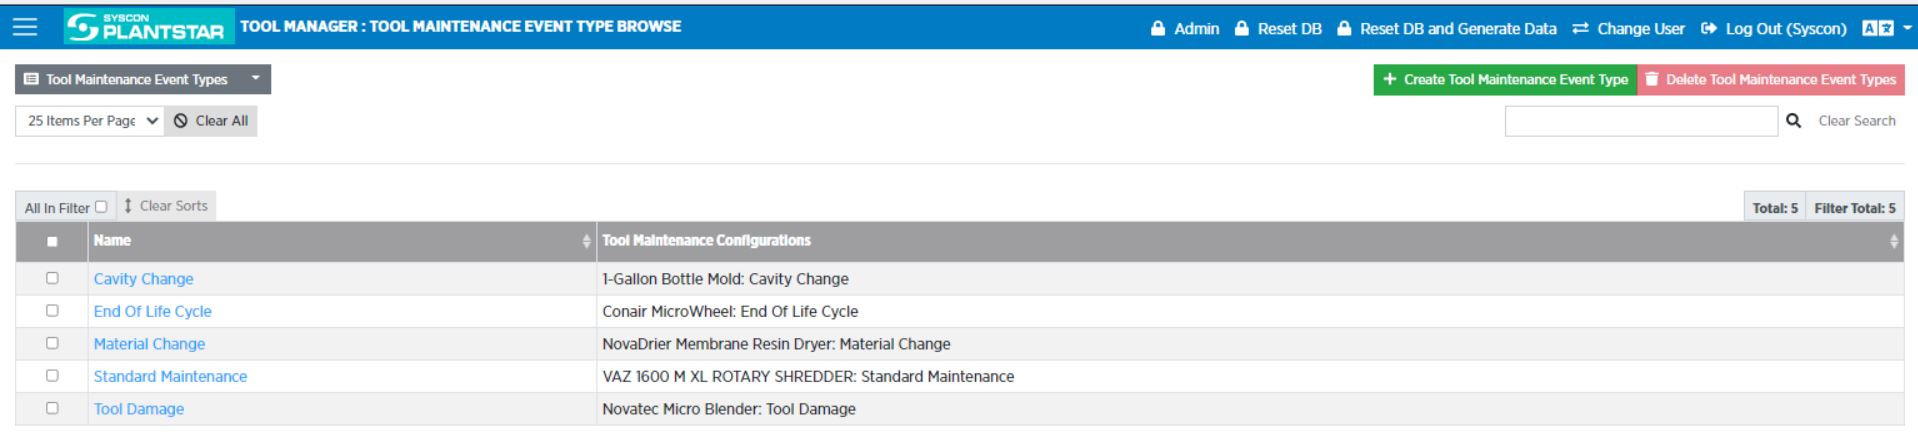
Tool Maintenance Events
Process Monitoring Features
Physical or Machine Interface
Process Single Value
Process Profile
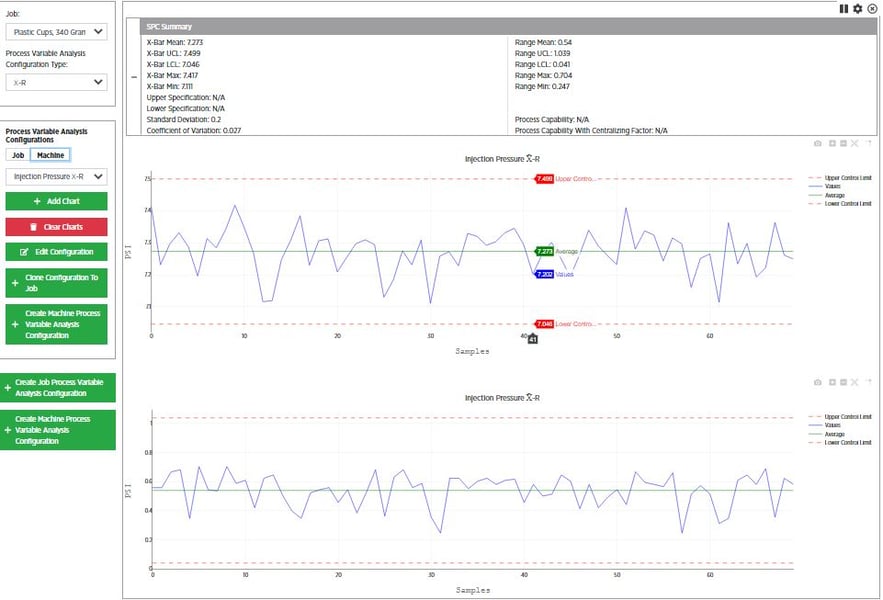
Process X Bar-R
Process Variable Table Viewer
Tailor Process Variable Limits
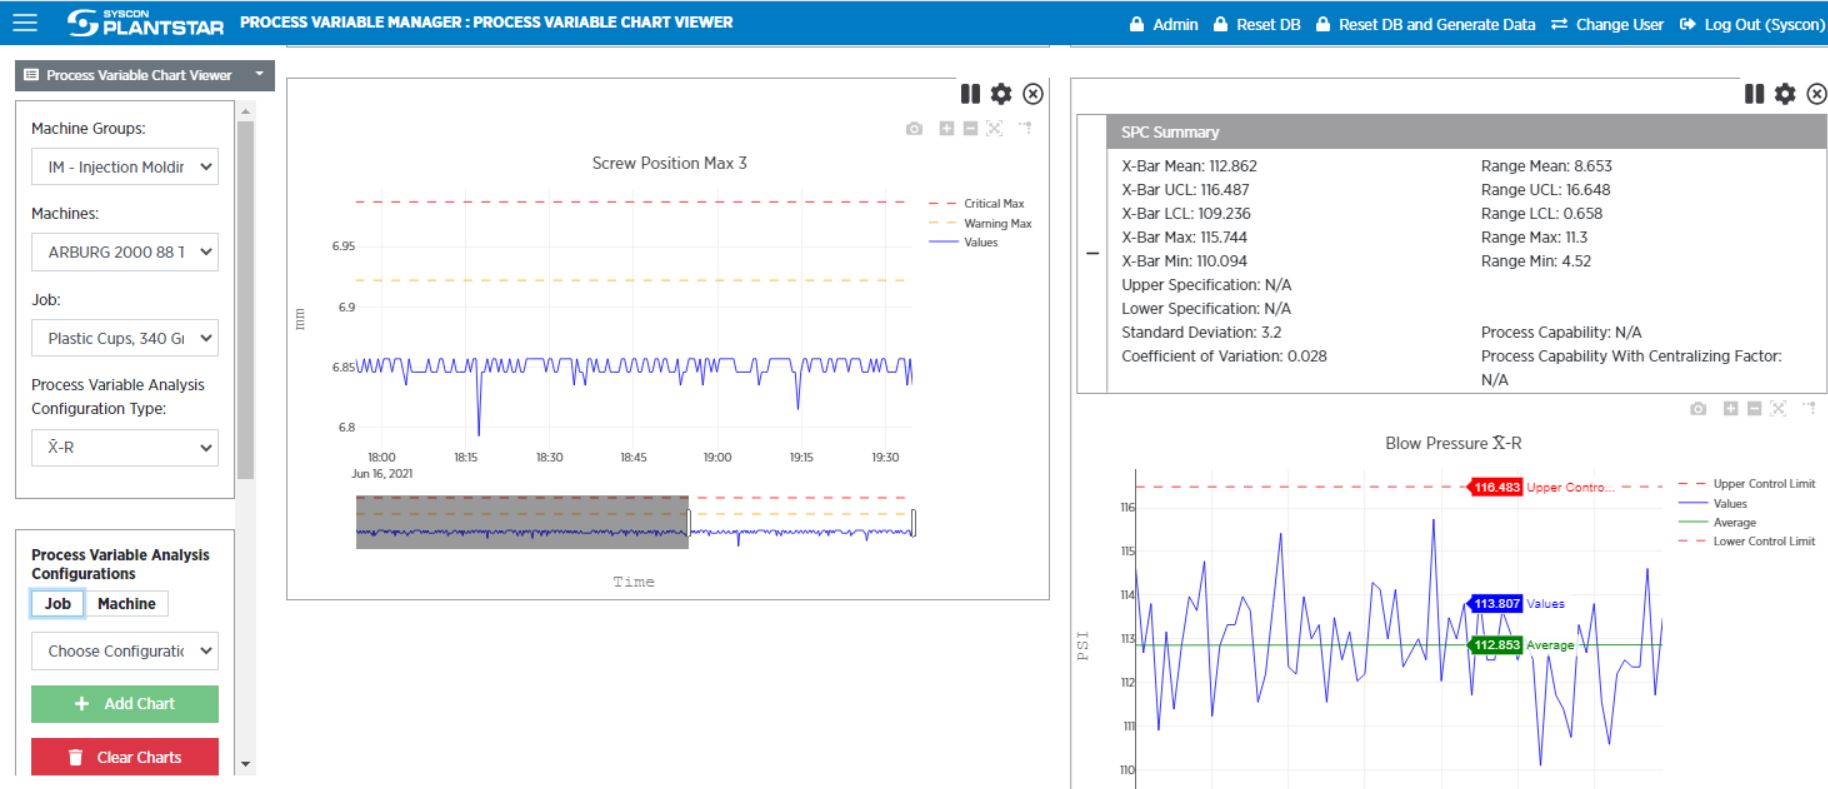
Process Variable Chart Viewer
Process Trend SPC
Process Variables Injection Molding
Process Variables Blow Molding
Process Variables Extrusion Blow Molding
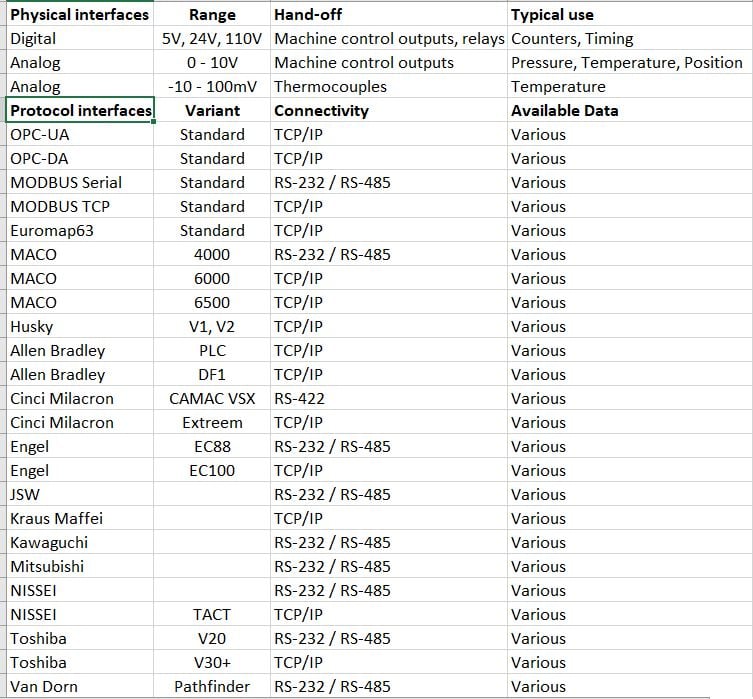
Physical or Machine Interface
Process Single Value
Process Profile

Process X Bar-R
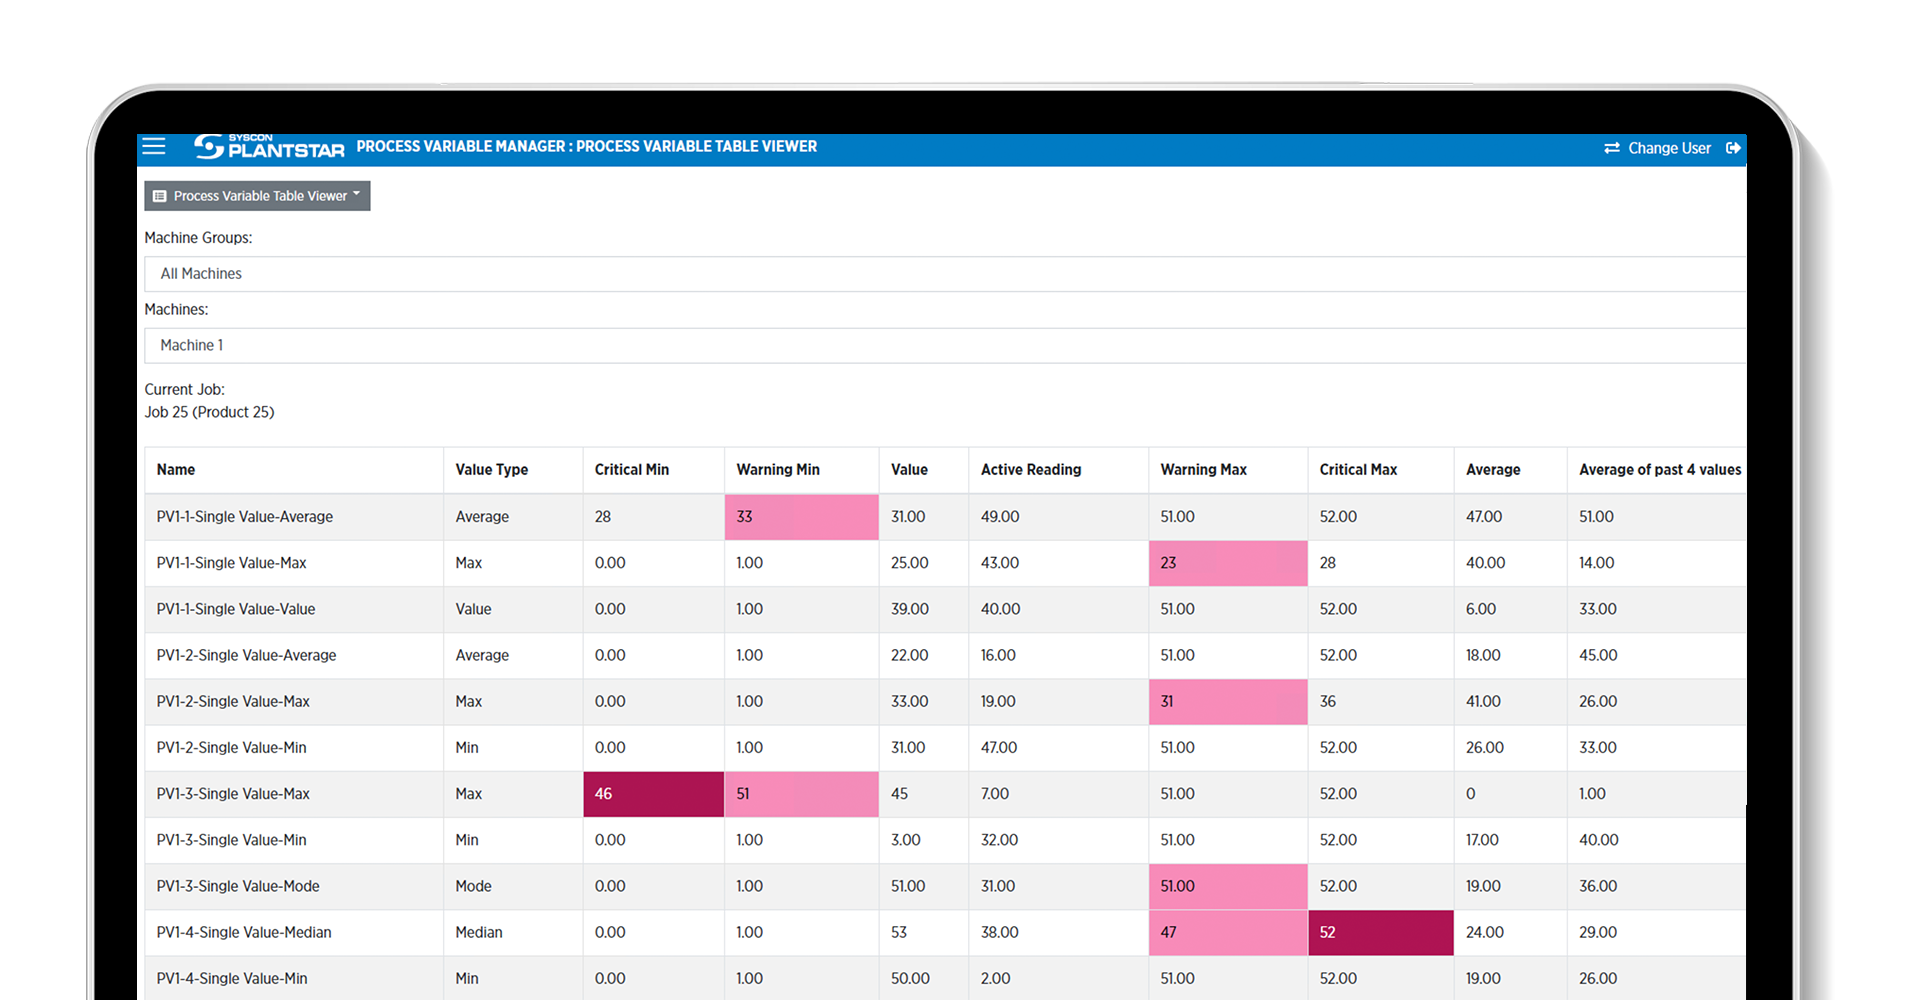
Process Variable Table Viewer
Tailor Process Variable Limits
Process Variable Chart Viewer
Process Trend SPC
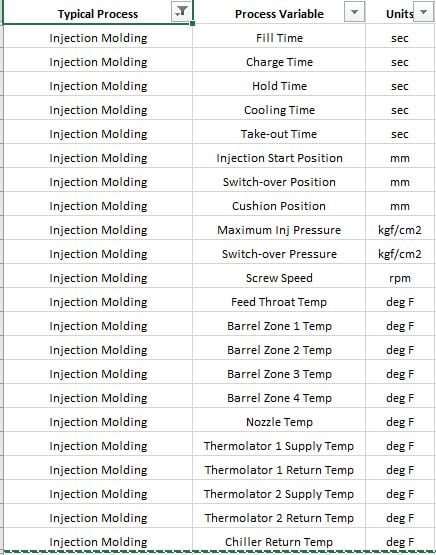
Process Variables Injection Molding
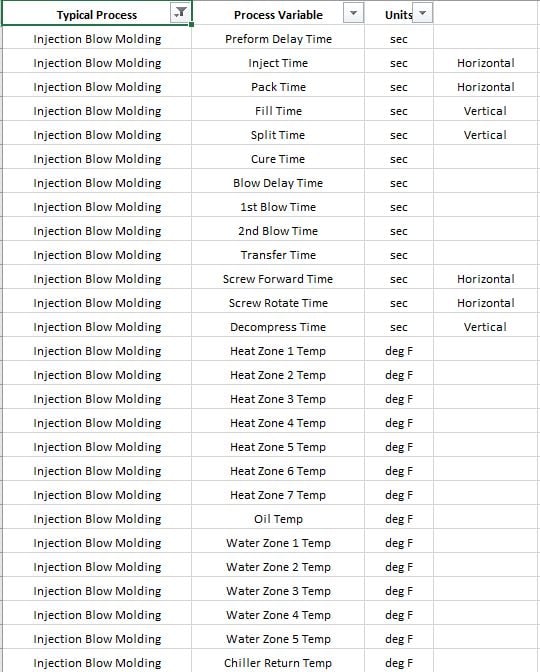
Process Variables Blow Molding
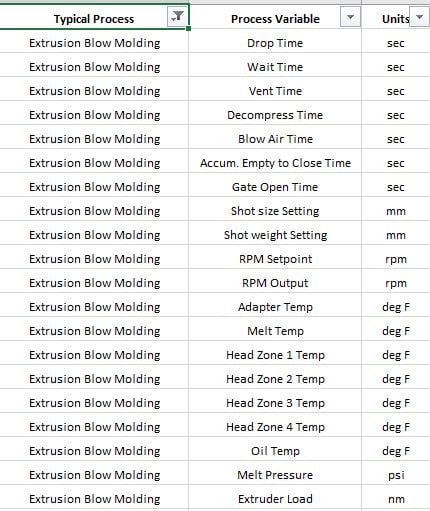
Process Variables Extrusion Blow Molding
See The Benefits of Robust MES Software
Could your manufacturing operation benefit from more data? With a robust Manufacturing Execution System (MES), you can combine Production & Process Monitoring to improve productivity and ensure quality and efficiency.


.png)